The documentation set for this product strives to use bias-free language. For the purposes of this documentation set, bias-free is defined as language that does not imply discrimination based on age, disability, gender, racial identity, ethnic identity, sexual orientation, socioeconomic status, and intersectionality. Exceptions may be present in the documentation due to language that is hardcoded in the user interfaces of the product software, language used based on RFP documentation, or language that is used by a referenced third-party product. Learn more about how Cisco is using Inclusive Language.
Generic Attribute Registration Protocol (GARP) VLAN Registration Protocol (GVRP) allows switches and other bridge network devices with GVRP capabilities to uniquely exchange VLAN configuration information and permit dynamically managed VLANs.
GARP packets can contain multiple messages and each message can contain multiple attributes. Each message has an attribute type, and each attribute has a length, event, and a value. The event in an attribute determines to register or remove that attribute and whether to send a message of its own. A GVRP participant sends the VLAN ID in GARP packets and the switch is able to record the VLAN a device is in and through which port that it can be reached.
The Statistics page on the 300 Series Managed Switches web interface displays all the GVRP activity for the interface configured for GVRP. This article explains how to view the GVRP statistics on the 300 Series Managed Switches.
• SF/SG 300 Series Managed Switches
Note: GVRP Global Status must be enabled. Also, GVRP must be enabled on the interface you wish to view GVRP statistics. For more information about GVRP configuration, refer to the article Configuration of GARP VLAN Registration Protocol (GVRP) on 300 Series Managed Switches.
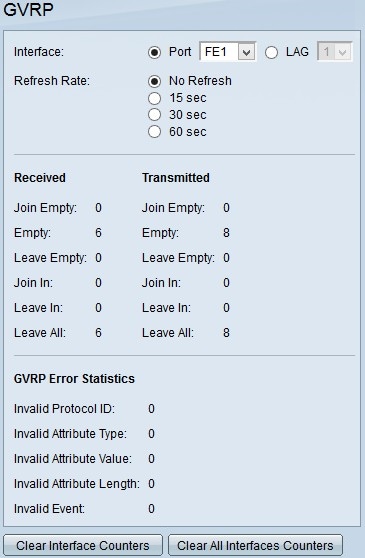
Step 1. Log in to the web configuration utility and choose Status and Statistics > GVRP. The GVRP page opens:

Step 2. Click the radio button of one of the available types of interface in the Interface field. The available types of interface are:
• Port — Choose from the Port drop-down list the physical port you wish to view GVRP statistics from.
• LAG — Choose from the Link Aggregation Group (LAG) drop-down list the LAG port you wish to view GVRP statistics from. A LAG port is a logical port that combines the capabilities of multiple physical ports to provide more bandwidth.
Step 3. Click one of the available options to refresh the GVRP statistic information in the Refresh Rate field. The available options are:
• No Refresh — Choose this option to not refresh the GVRP page.
• 15 sec — Choose this option to refresh the GVRP page every 15 seconds.
• 30 sec — Choose this option to refresh the GVRP page every 30 seconds.
• 60 sec — Choose this option to refresh the GVRP page every 60 seconds.
The GVRP page displays the following information about GVRP traffic on the chosen interface:
• Received/Transmitted GVRP Packets:
– Join Empty — Number of packets sent to declare an attribute not registered on the device who sent the attribute.
– Empty — Number packets sent to prompt other devices to send Join In and Join Empty packets.
– Leave Empty — Number of packets sent to remove an attribute not registered on the device sending it.
– Join In — Number of packets sent to declare an attribute registered on the device who sent the attribute.
– Leave In — Number of packets sent to remove an attribute registered on the device that sent the attribute.
– Leave All — Number of packets sent to remove all attributes.
• GVRP Error Statistics
– Invalid Protocol ID — Number of packets with protocol ID errors.
– Invalid Attribute Type — Number of packets with errors in the message.
– Invalid Attribute Value — Number of packets with errors in the Attribute Value. The Attribute Value holds the VLAN ID.
– Invalid Attribute Length — Number of packets with errors in the Attribute Length.
– Invalid Attribute Event — Number of packets with attribute event errors. The Attribute Event describes the event to perform for this attribute when received.
Step 4. (Optional) To clear the GVRP traffic statistics for the selected interface click Clear Interface Counters.
Step 5. (Optional) To clear the counters on all the interfaces click Clear All Interfaces Counters.